Easy to use
A PipeWeb model is constructed on-screen by placing node objects on a worksheet and interconnecting the nodes by links in a fully graphical user interface. The links represent pipes. Nodes represent equipment and controls. With a single button push, the solver engine will find the distribution of pressure and flow rates in the model for steady state, dynamic or transient conditions.

Plenty of tools
PipeWeb is well-documented and offers context-sensitive help. Useful utilities that assist model construction and operation include customizable template repositories for nodes and pipes, advanced result inspection tools, such as animation of transient parameters and distribution contour plots. There are also incorporated tables for ANSI pipe dimensions and minor loss coefficients.

Accessible results
Results can be inspected in various manners. Calculated data are presented in well-organized tables and charts, which yiu may incorporate into the model worksheet. Color contour plots can be used to demonstrate the distribution of node parameters across the model. In addition, PipeWeb can visualize dynamic and transient data by animation, which greatly benefits the examination and communication of results. Water hammer effects can be observed in animated charts, and color contour plots can be animated for dynamic data.

Intuitive interface
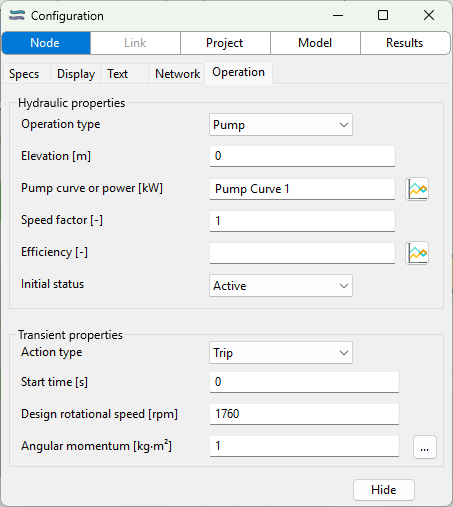
PipeWeb has an intuitive graphical user interface. You can use convenient mouse drag-and drop actions to construct a model. It also offers on-screen piping layout routing control, with support for spline, polygon and orthogonal curve types. All object properties are accessible in a single window and properties of multiple selected objects may be modified jointly by a single action.
Feature List
- Context sensitive help.
- Detailed and complete user manual.
- Intuitive graphical user interface.
- Node creation, positioning and duplication by drag-drop mouse actions.
- On-screen mouse-controlled piping routing.
- Splines, polygons and orthogonal curves.
- Advanced selection methods, including grouping.
- Support for undo, redo and repeat.
- Cut, copy & paste of objects through the clipboard.
- Dynamic viewport scaling and translation.
- Hidden or locked layers.
- Adaptable alignment utility.
- Fusion of model sections into sub-windows.
- User-defined node and pipe templates.
- Viewport page configuration with automatic cross-linking.
- Support for steady state operatons, watter hammer phenomena, and conditions involving gradual changes in quasi-steady state.
- Support for pressure sustaining and pressure reducing control valves, and flow control valves.
- Characteristics curve editor for various node type properties.
- Valve characteristics specification (Pipeweb pro version required)
- Flexible transient incident incitation, including valve modulation and pump trips.
- Various surge mitigator equipment types. (Pipeweb pro version required for some)
- Fully EPANET compatible.
- Data visualization in fully customizable column and line charts.
- Tabulated display of parameter values.
- Node parameter value color contour plots on the worksheet.
- Transient hydraulic shock effects in animated charts.
- Animated contour plots.
- Bitmap repository for node icon customization.
- Text search capabilities.
- Window arrangement utility.
- Application preferences.
Release notes
Version 6.00.006
April 19, 2025